
The data x-ray
Anyone with the right mindset of using and analyzing data for decision making is creating for the company a tremendous competitive advantage. And although not everybody will succeed in being as data-driven as Netflix or Booking.com, the path to glory starts with baby steps.
But good things don’t always come easy and the road is usually lined with pitfalls.
The first problem organizations have is that they are not using enough data. Why? Again, decisions are wrongly based on instincts, the outcomes of past experiences that “worked”, or on the opinion of the highest paid authority.
The second is that, if the do it, they focus on too many metrics or are wrongly interpreted.
Third, organizations tend to focus on vanity metrics only (such as revenue or profit) and fail to take into consideration the overall value that the company provides to its customers.
In the next part of this chapter, we will address these issues and learn how to properly make use of data.
Top metrics
If the company has already identified its top KPI and North Star Metric (NSM), then a big chunk of the work is already done. If not, work with your management and try to identify the two.
Next, check if they are in alignment:
“Is the NSM contributing directly to the top KPI?”
If so, start paying special attention to the NSM. Having this one metric that matters is of key importance for improving the focus, flexibility, and tempo of the team. If not, then see how can you reach this alignment (mostly done by picking up different metrics).
Supporting metrics
The next step is to identify the supporting metrics that, together, give the North Star Metric its awesome guidance power:
“What metrics make up our NSM?”
Then, break those further into even smaller metrics.
Do realize that this is an ongoing iterative process which is very specific to the product you are developing.
The result will be a “metrics tree” that offers a clear view of the company’s areas of focus.
For Pillar, it looked something like this:
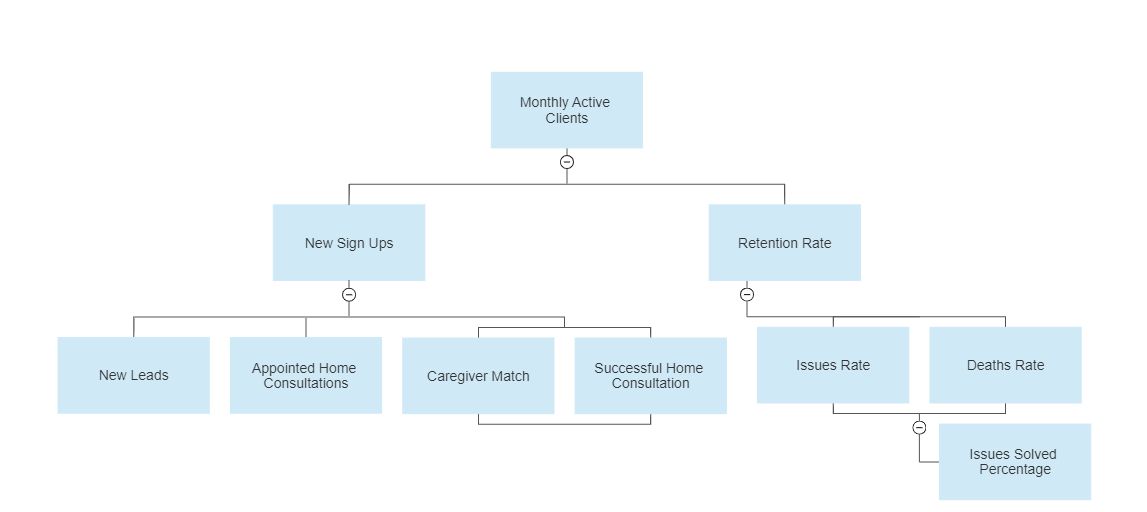
Once the metrics tree in place, analyze it and figure out what metrics, once improved, would move the big needle the most and make the NSM even brighter? Mark those as important.
Gather your extended team (management, sales, data, marketing, tech, etc) and use your analytics tool to create a living dashboard depicting these important metrics.
Example
Think of it as the health dashboard of the product. You can keep track of it yourself with the help of management or establish periodically growth meetings involving relevant individuals and review it in detail. As you look at the charts, ask questions such as:
- What is the current trend? Is it going up , down or remaining flat?
- If the trend changes what could have caused that?
- Are there any anomalies in the data, for example, a particularly good period?
- How do different demographic data compare?
Get as creative as you can in asking these questions as the answers will serve you later into developing solid hypotheses on how to improve your product.
But what if you don’t have any major experience in data analysis? Based on my experience, analyzing basic data and formulating hypotheses is not rocket science at all. Patterns speak for themselves and we, humans, have evolved to quickly recognize and make use of them in our advantage.
Leave a Reply